Dear Editor,
I am grateful for the informative piece written by my professional colleague Mr. Dhanraj Singh captioned `State of the economy is likely to worsen more than casually projected’ in the July 22nd edition of Stabroek News. Only those who are out of touch to the plight of the people will not conveniently see Dhanraj’s point and attempt to mask the reality of increasing poverty using an indicator called economic growth.
One just has to look at the variance analysis between the 2019 budget numbers and the End of Year Outcome Report and it tells a story of a bogus budget process. While these figures are not supposed to line up exactly, there are stark differences in the numbers, which exposes the weakness in the enterprise of preparing the National Budget before the start of the Budget Year.
But there is a deeper question in this debate on economic growth and it is this – has any of this calculated growth filtered down to the people at the bottom half of the economic ladder? One only has to use a simple case to explain that economic growth does not means anything to those at the bottom, if the top 1% grabs all of the economic growth.
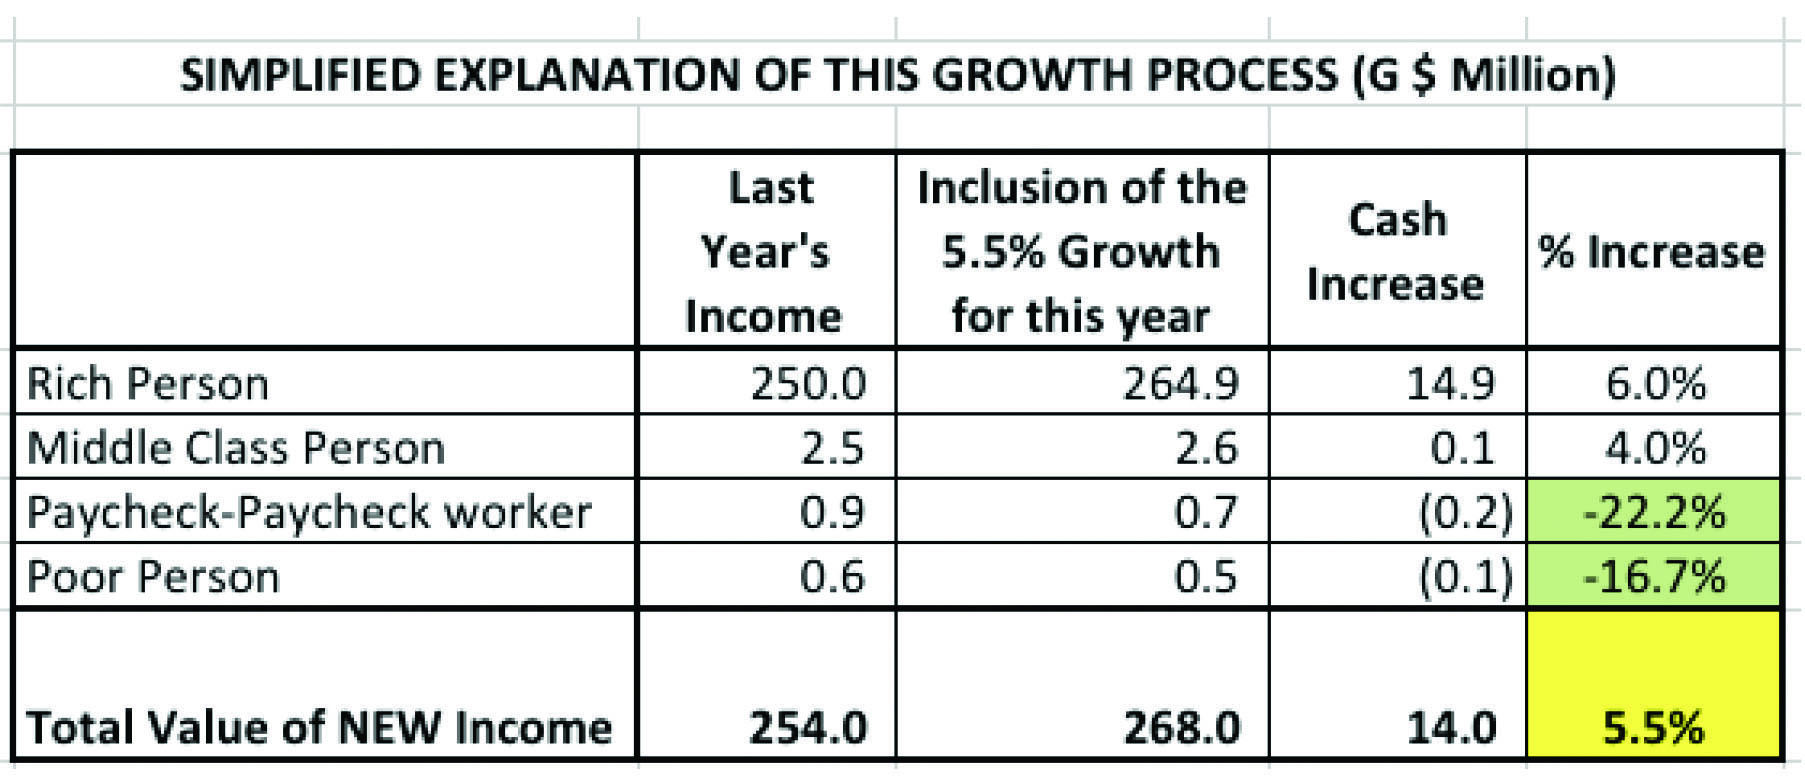
In this example, we are using the case of a nation with 4 persons to make the point – the Rich Man, the Middle-Class Man, the Paycheck-to-Paycheck Worker, and the Poor Man. An increase in the economic growth of 5.5% means nothing to anyone until and unless there is new cash in his or her pockets. As the Table proves, in this 4-person economy, while there is a 5.4% growth, the Poor Person and the person who is living from Paycheck to Paycheck experienced a reduction of 16% and 22% respectively in their annual income because the Rich Person experienced a 6% growth. This is the substance of today’s Guyana, the many are experiencing declining purchasing power while the few are doing better.
I have spent days in the fields, especially in the various squatting areas and I can conclude confidently, too many Guyanese are experiencing measurable economic decline. But if you lock yourselves away from the people, you will perpetually fall for the academic generalized computations that have little relevance to human development. This is the hard truth – since Mr. Granger came into office, life has gotten so much harder for so many at the bottom half of the income scale. There is less income for them, there is a marked deterioration of their assets profile and there are fewer jobs for them.
Consumption and the impending collapse in Human Development
So while Team Granger preaches that the economy grew by 5.4%, did they study the unemployment rate to find out if it has also declined by 5.4% taking thousands of our people out of poverty? I direct them to the Guyana Labour Force Survey as put out by the Bureau of Statistics.
In that document, one would find that at the end of 2017 – the labour force participation rate was 54.5%. By the end of 2019, that rate dropped to 49.1%, which is clear evidence that the labour force participation rate has declined. When you drill down to the unemployment rate – it was 12.2% at the end of 2017 and it has increased to 13.4% by the end of 2019. When one reflects on youth unemployment, it increased from 22.9% at the end of 2017 to 29.7% at the end of 2019. So there are fewer people participating in work and more people unemployed.
Let us not forget that during Granger’s tenure some 11,000 persons lost their jobs directly and indirectly in the sugar belt and there are many more such cases in other parts of the productive sector. And how can we forget that since March 2020 because of the COVID-19 pandemic and the political epidemic created by Team Granger, more than 30,000 more persons have been furloughed (at home with reduced pay and in some case no pay)? So while we speak loosely of economic growth in Urquhart Street, we are failing to comprehend the extent of the damage to Main Street. So what really will such a situation do to aggregate consumption in the non-oil economy, if not drive it down? Think!
Support to Agriculture
If one is to evaluate the Agriculture Sector Budget numbers as sourced by Team Granger from the Ministry of Finance, we find that only absolute numbers were used. How more disingenuous can these people get? Any finance professional worth his salt would know that in order to tell an accurate story one uses ratio analysis to establish the trends; not absolute numbers.
It is more efficient to use a ratio analysis such as Total Budget Allocation to the Agriculture Sector to the Total Budget to make your point. Such a ratio confirmed that Dhanraj was correct when he pointed to the fact that Team Granger was starving the agriculture sector of essential funding. The graph below shows a declining trend of the budget allocation to the Agriculture Sector since 2015 from a high of over 10% of the total budget to below 6% by 2019 (this represents a decline in financial commitment to the sector by some 46% since 2015).
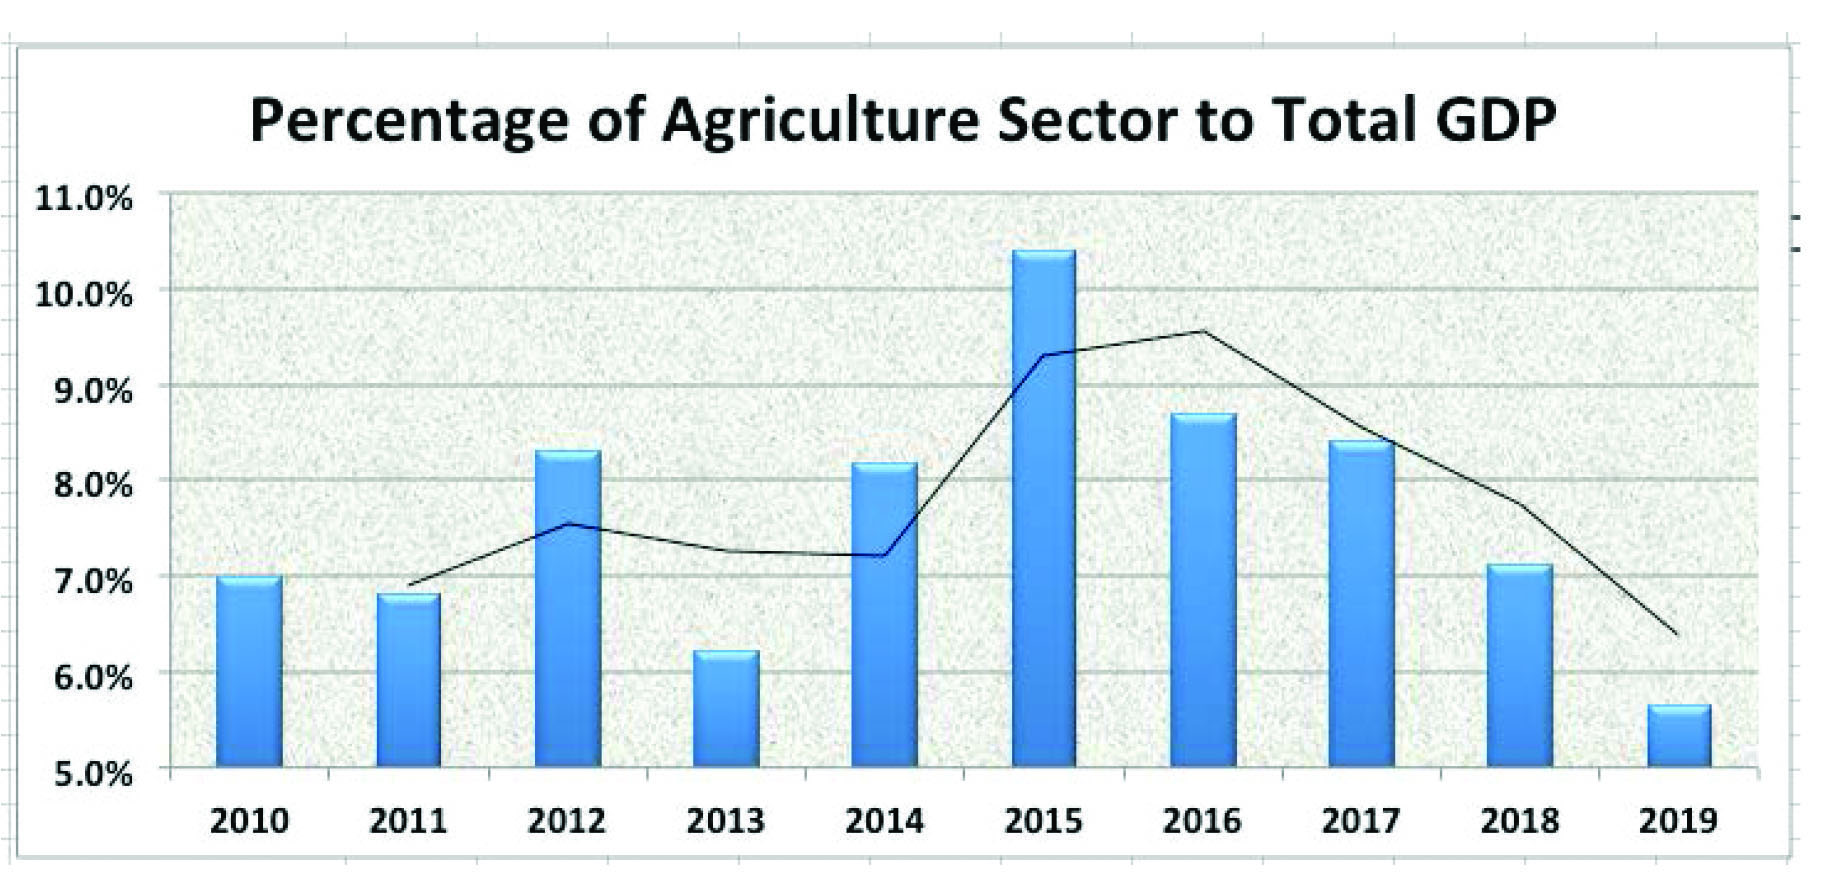
It would be remiss of me not to point out that 2019 saw the lowest levels of proportionate budgetary support for the Agriculture Sector since 2010. So where have all the billions disappeared since 2015? To emphasize my point, in March 2015, a few months before the PPPC left office, the Government Deposit as per the Bank of Guyana Report was G$15.2 billion. As of July 8, 2020, all that cash has been depleted, and an overdraft of (minus) G$93.5 billion was recklessly incurred as evidence of the “squandermania” under Team Granger. You can label it what you want: intertemporal outflows; cash outflows – it is what it is – outright plundering of the people’s cash on primarily non-value-added projects grounding in a childish obsession of parade, pageantry and wildly “living it up” on other people’s money like a leech.
So there was insufficient cash for the productive sectors but there was much for a plethora of large-scale corrupt projects that have added very little value to the real lives of the real people; the poor and the working class. For example, there was the G$1.4 billion D’Urban Park Project. To what end where is the value for money? Then there is the almost G$300 million spent on a feasibility study on a bridge that was custom-fitted to land on the property of another member of the inner cabal. To what end? Mind you the contract for the design work was signed at G$146 million while almost G$300 million was spent without parliamentary approval. Then there is the Sussex Street bond fiasco where another party man bought a house for G$40 million and was able to yield rent totaling G$450 million over 3 years as a handsome payback. Was this because of his political loyalty?
I can go on and on since there is enough evidence to prove why there was a depletion of all of the Government’s savings in the public deposit account, which resulted in a debt of close to G$100 billion being incurred. But when you ask how much of this was spent on empowering the poor and the working class, you get total silence from Team Granger.
Yours faithfully,
Sasenarine Singh